Tuesday, December 17, 2013

Trading Gold

The posts on this blog have been about trading currency pairs; in this post is the content about commodities. The commodity is gold.

Gold
Gold is a commodity and the most of it comes from India and is used in jewelry and industries.

Impact on the price of gold
Industries
The demand and supply of these industries have an impact on the pricing.

Big events
Big events as the Indian wedding seasons (from September to December) have also impact on the price.

The dollar, inflation and interest rate
The price of gold is valued in dollars which makes the price of the dollar an element in the pricing. As currencies are influenced by the inflation rate and the interest rate are they also factors that influence the price of gold.   

The inflation is measured by the consumer price index (CPI); if the inflation starts to rise the impact of the gold price is negative which means that the price will fall on gold.

Before starting to hedge gold and inflation it would be a good idea to know the inflation rate around the world as the inflation's impact on the gold is not equivalent cause to the calculation of the inflation rate.

The price of gold
The price of gold in 2013 has been bearish; as it is decreased from 1.780 dollars in October 2012 to 1.230 in December 2013.


In the short run gold has been bullish and bearish.


How to buy gold
Gold can be brought on an online CFD trading platform; gold is placed under the section commodities.

More about how to trade on an online trading platform is illustrated in the video on my website.  

Thursday, December 12, 2013

Trading CFD: Correlation between AUD/CHF, AUD/USD and EUR/USD

In the post CFD Trading: Correlation between Currency Pairs is written about some common correlation between currency pairs.

In this post
In this post is the focus on the correlation between the AUD/CHF and AUD/USD. The correlation between the AUD/CHF and the EUR/USD is also illustrated.

The purpose is illustrative only.

Correlation
The correlation between currency pairs can be stronger or weaker over a time period. 

In this post is illustrated how the correlation is at the 15 minute charts; the correlation could be stronger or weaker if the correlation was illustrated in charts where the time period was longer or shorter.

Often is the correlation strong or weak as illustrated. The correlation can also be opposite as illustrated in the charts from 10:45.

The correlation between AUD/CHF and AUD/USD
The charts illustrate the correlation between the AUD/CHF and AUD/USD; the charts illustrate a positive correlation between the currency pairs.

The correlation is weaker at 10:45 than it was between 1:45 and 10:45 as the AUD/CHF is decreasing and the AUD/USD becomes flatter.


The correlation between AUD/CHF and EUR/USD
The charts illustrate the correlation between the AUD/CHF and EUR/USD; the charts illustrate a negative correlation between the currency pairs.

The correlation is weaker at 12:30 than it was between 1:45 and 10:45 as the AUD/CHF is increasing and the AUD/USD is increasing.


Tuesday, December 10, 2013

Correlation between NZD/USD and EUR/USD, GPB/USD, AUD/USD

Correlation between currency pairs is a factor in trading CFD and should be considered before entering a trade.

In this post is the correlation between the NZD/USD and EUR/USD, GPB/USD, AUD/USD illustrated visual in the charts under the section Visual illustration. The purpose is to exemplify the correlation between currency pairs and give a little inspiration on how to think as a trader.

The correlation between NZD/USD and EUR/USD, GPB/USD, AUD/USD are usually strong as changes in the USD has effect on all the currency pairs in the same direction.

Visual illustration
Visual are the charts NZD/USD and EUR/USD, GPB/USD, AUD/USD illustrated; the charts illustrate how the currency pairs are moving in the same direction with a small delay. 


The NZD/USD is increasing (bullish) approximately at 2:15 and again at 9:45 which is also the case for the EUR/USD, GPB/USD and AUD/USD; some of the currency pairs start to rise (bullish) at approximately 9:00 o’clock.  The EUR/USD is rising (bullish) for a shorter period than the NZD/USD, GPB/USD and AUD/USD. 

Monday, December 9, 2013

CFD Trading: Goals

I have been studying the tropic positive psychology a bit deeper the last couple of months.

One of the interesting part is that well-being is valued higher when a person can explain why he or she is at certain points in life but also can explain how to come to the next level.

Another interesting part is that well-being is connected to grow and our well-being is increasing as we grow but only if we have an influence on the progress. Well-being can also be life stages where the goals are reached and where the feeling complacency and tranquility is present.

Well-being in connection to CFD
Well-being is also important in trading CFD as we have to set goals for our trading; the purpose is to measure if we reached our goals. An example of a goal could be a surplus of 20 pips each trading day.

A trading plan is also important as it explains why you are acting as you are; it explains also your goals and if you have reached them; in connection to positive psychology should it have influences on your well-being as you know why you are entering a trade and why you are closing a trade.

Writing your goals
Writing a trading plan makes you more conscious about the goals you want to achieve and how to achieve them. Your conscious about your goals makes it also easier to reach them.

More about psychology trading
In the articles;


are written about visualization techniques that might be helpful in growing your well-being in trading CFD.

Wednesday, December 4, 2013

CFD Trading: The Risk and the Reward Fraction

CFD trading has large potential rewards and potential risks. In this post is the purpose to write about the risk and the reward in a trade.

Risk and reward
A risk in a trade is the possibility to lose money on a trade. A reward is the possibility to earn a profit in a trade.

The fraction between the risk and the reward should be 1:3 or more for new traders. If the risk is 25 dollars is the expected reward 75 dollars. The 25 dollars is the stop loss level and the 75 dollars are the profit takes level.

The fraction for experienced traders could be set to 1:2.

How to use the risk and the reward fraction?
The risk and reward fraction is an overall fraction in a trading plan; if the fraction is set to 1:3 in each trade during a trading day is the overall fraction also 1:3.

Example: The trades
The trading day consists of 6 trades; the profit takes are set to 60 dollars; as the risk and the reward fraction is set to 1:3 is the stop Loss level set to 20 dollars.

Three of the trades are closed due to the profit takes and two of them are closed due to the stop loss level.

The profit is 120 dollars; 3 times 60 dollars minus 3 times 20 dollars.

Example: A trade is added to the trading day
The trader adds a trade in his trading plan but the trade is closed due to the stop loss level.

The profit is 100 dollars; 3 times 60 dollars minus 4 times 20 dollars.

Example: Conclusion
In the example are the risk and the reward fraction as planned but shrink as the trader adds a trade.

The trader’s planned fraction is lower than expected as he added an extra trade in his trading plan; but he still has a surplus.

Stop Loss
It is difficult for both new traders and more experienced traders to set a stop loss level.

Examples of how to set a stop loss level is in the article “Trading Forex Online? How to Define an Exit Point, AlsoCalled a Stop/Loss?” .

Monday, December 2, 2013

CFD Trading: Correlation between USDCAD and GBPUSD

In the last post was the correlation between the EURUSD and USDCHF illustrated.

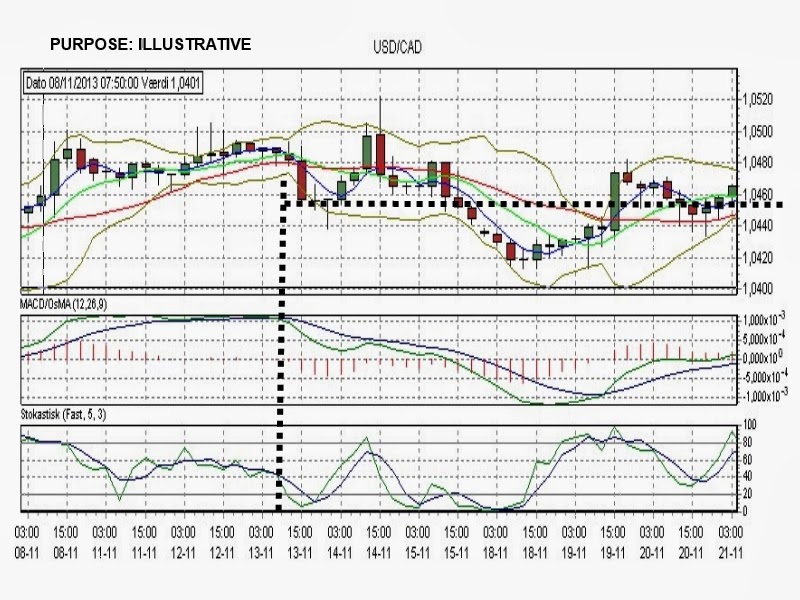
In this post is the correlation between the USDCAD and the GBPUSD illustrated. The purpose is only illustrative and inspirational in trading the USDCAD and GBPUSD.

Correlation between USDCAD and GBPUSD
I was watching the USDCAD and the GBPUSD on the charts and the visual correlation is that if the USDCAD is going sideways is the GBPUSD often in and uptrend or in a downtrend.

The trend of the GBPUSD should not affect the USDCAD if it is going sideways.

An Example
The charts are the USDCAD and the GBPUSD; the USDCAD is going sideways and the GBPUSD is in an uptrend; the GBPUSD trend does not affect the currency rate on the USDCAD as it is going sideways.


Another example
The first example was over a longer time period; this example is over a shorter time period.

The currency pair is the USDCAD and the GPBUSD: the USDCAD is going sideways and the GBPUSD is in an uptrend; the GBPUSD trend does not affect the currency rate on the USDCAD as it is going sideways.


Comment
Please leave a comment if you have some interesting correlation between currency pairs. 

Wednesday, November 27, 2013

CFD Trading: Correlation between Currency Pairs Part 2

In the post CFD Trading: Correlation between Currency Pairs is written about the correlation between the currency pairs.

In this post is illustrated the correlation between the EURUSD and the USDCHF; the correlation between the EURUSD and the USDJYP is also illustrated.

Correlation between EUR/USD and USD/CHF
The chart illustrates the EURUSD and the USDCHF; the EURUSD starts to fall around 3 o’clock and the USDCHF starts to rise around 3 o’clock; the 4, 9 and 18 period moving averages are also crossing each other around 3 o’clock; they are reverse; at the EURUSD chart are the 18 period line above the 4 and 9 period lines; at the USDCHF chart are the 18 period line below the 4 and 9 period lines.

Correlation between EUR/USD and USD/JYP
The chart illustrates the EURUSD and the USDJYP; the EURUSD starts to fall around 3 o’clock and the USDJYP starts to rise around 3 o’clock; the 4, 9 and 18 period moving averages are also crossing each other around 3 o’clock; they are reverse; at the EURUSD chart are the 18 period line above the 4 and 9 period lines; at the USDJYP chart are the 18 period line below the 4 and 9 period lines. 


The charts are illustrative but the print is from a real chart; the correlation between currency pairs is stronger or weaker over a time period. 

CFD Trading: Trading with the 4, 9 and 18 Period Simple Moving Average

The simple moving average is described in the post CFD Trading: The Simple Moving Average.

In this post is described how to trade with the 4, 9 and 18 period simple moving average and how to read the signals they provide.

The 4, 9 and 18 Period Simple Moving Average
The 4, 9 and 18 period moving average is a common used.

When the 4 and 9 period moving average crosses each other is the first signal given that a change is in the price development is started. The change is confirmed when the 4 and 9 moving average is above the 18 period moving average.

An example
In the image is the AUDUSD price chart; in the chart are the 3 simple moving averages; the 4 period is the blue line; the 9 period is the lime line and the 18 period is the red line.  

The example illustrates how the price line starts to change from and up going development to and down going development as the three simple moving averages is crossing each other as described in the beginning of this post.  

The same price line is in the image below illustrated with price bars.


Wednesday, November 6, 2013

Trading with the ADX/DMI, MACD/DMI, Bollinger Bands and Stochastic

In earlier posts is the ADX/DMI, MACD/DMI, Bollinger Bands and stochastic illustrated.

Purpose of this post
In this post is the purpose to analyzing the EUR/USD with the four indicators. The purpose is to illustrate the thought in using the indicators.

How to analysis with the ADX/DMI, MACD/DMI, Bollinger Bands and Stochastic?
The chart is the EUR/USD and illustrates the price chart in the morning: from 7:15 until 9:15 is the price falling; at 9:15 is the price starting to increase.
Bollinger Bands an the stochastic
Between 9:15 and 9:30 is an indication that the price is starting to move in an upper direction; the lower Bollinger band and the price line are crossing each other and the stochastic is indicating that the EUR/USD is oversold.

Between 10:30 and 10:45 is the upper band crossing the price line and the stochastic is indicating that the EUR/USD is overbought.

ADX/DMI: How strong is the trend?
Between 9:15 and 9:50 is the red line above the green line; it indicates that the trend is negative.

At 9:50 is the green line crossing the red line; it indicates that the trend is positive and the price is increasing.

MACD/DMI: How likely is the trend?
Between 9:15 and 9:50 is the blue line above the green line; it indicates that the trend is unlikely. The histogram confirms the indication.

At 9:50 is the green line crossing the blue line; it indicates that the trend is likely and the price is increasing. The histogram confirms the indication.

When to buy?
The Bollinger bands and the stochastic indicate that the buy signal is between 9:15 and 9:30 as the lower band cross the price line and the stochastic indicates that the EUR/USD is oversold.

The ADX/DMI and MACD/DMI indicates that the buy signal is at 9:50.

The entry in the market would be at 9:50 as the ADX/DMI and MACD/DMI indicate a likely trend.

At the same time period is the stochastic in an overbought zone; which would have been a signal that the price soon will start to fall. It would have been true if only the Bollinger Bands and the Stochastic was used as indicators.

In this analysis is also the ADX/DMI and MACD/DMI used; they confirm a likely up going trend.

When to sell?
At 10:00 are the upper band and the price line crossing each other; the price is still increasing and the trend is likely.

At 10:40 are the price line and the upper band again crossing each other and the trend is less likely. The stochastic is also indicating that the price is decreasing.

The analysis indicates that the sell signal is at 10:40.

Please note
Please note that this post is only illustrative and the purpose is to give insight into how to trade with indicators.