In this post is the pennant chart pattern illustrated; the pattern is a continuation pattern as it is a part of an already existing trend. The pennant pattern is a break in the already existing trend and looks like the triangle chart pattern.
Pennant Chart Pattern: downtrend
The image illustrates a downtrend; the trend is a pennant pattern and a breakout; it is often seen that the price returns to the breakout level and afterwards continues the trend.

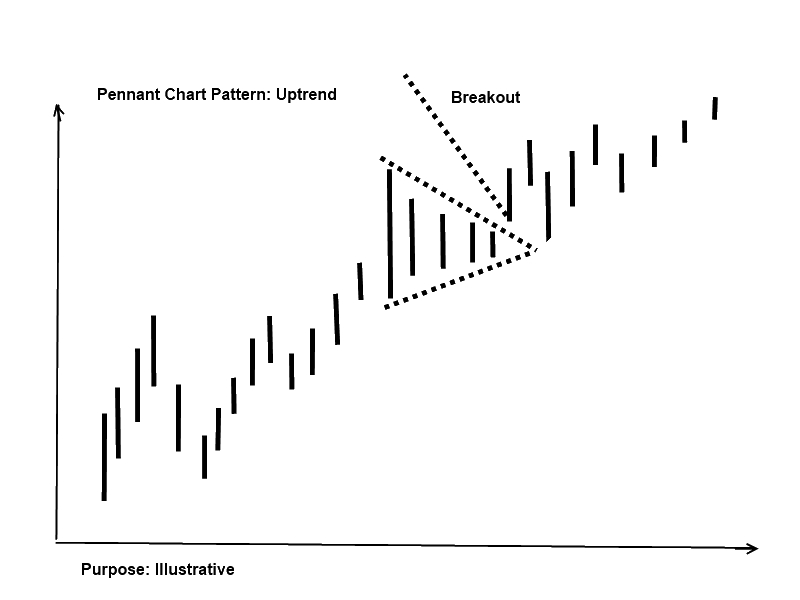
Pennant Chart Pattern: Uptrend
The image illustrates an uptrend; in the trend is a pennant pattern and a breakout; it is also often seen that the price returns to the breakout level and afterwards continues the trend as described in the downtrend section.